| Georgia’s Q1 Foreign Trade Down by 5% |
| Civil Georgia, Tbilisi / 25 Apr.'13 / 12:58 |

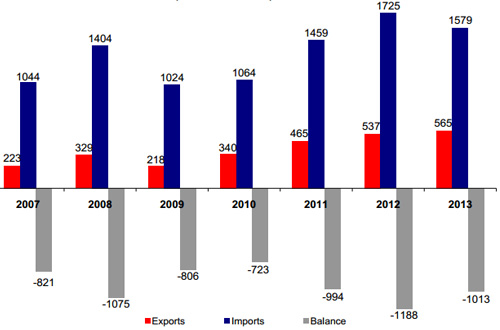
Georgia’s January-March foreign trade figures between 2007 and 2013 in million U.S. dollars. Source: Geostat.
Georgia’s foreign trade declined 5% year-to-year in the first quarter of 2013 to USD 2.14 billion due to reduction in imports, according to figures released by the state statistics office, Geostat, on April 24.
Georgia’s export amounted to USD 565 million in January-March, up by 5% y/y and import was USD 1.58 billion, an 8% decline over the same period of 2012.
Trade gap was slightly over USD 1 billion in the first quarter, a 14.7% y/y decrease.
Trade with Turkey, which is Georgia’s long-time largest trading partner, accounted USD 306.2 million in January-March 2013; while import from Turkey amounted to USD 269 million, export from Georgia to Turkey was only USD 37.1 million.
Turkey is followed by Azerbaijan with total trade turnover of USD 296.9 million; Ukraine – USD 157.3 million; China - USD 156 million; Russia – USD 121.3 million; Germany – USD 104.8 million; the United States - USD 102.6 million; Armenia – USD 84 million; Romania – USD 70.9 million; Bulgaria – USD 66.2 million.
Re-export of cars amounted to 24.8% of the country's total exports in the first quarter of 2013 with USD 140.4 million, a 33.1% y/y increase.
Ferroalloys made 12% of Georgia’s exports in January-March with 67.7 million, followed by nitrogen fertilizers with USD 36.3 million (its share in total export was 6.4%); hazelnut – USD 18 million (3.2%); non-denatured ethyl alcohol and spirits – USD 17.6 million (3.1%); raw or semi-processed gold – USD 16.5 million (2.9%); copper ores – USD 14.9 million (2.7%);
Export of mineral waters made 2.8% of total exports, increasing 35.5% y/y in January-March 2013 to USD 15.6 million.
Georgian wine export increased 34% y/y in value to USD 13.7 million in the first quarter of this year making its share in country’s total export 2.4%.
Oil products top the list of imports totaling USD 174 million making its share in total imports 11% in January-March 2013; like most of the main imported commodities (exceptions are mobile phones, railway passenger cars and meat products), value of imported oil products also saw decrease over the same period of last year.
Import of cars amounted USD 141.7 million; hydrocarbons - USD 102.5 million; medicines - USD 55.3 million; mobile and other wireless phones - USD 27.07 million (22.6% y/y increase); railway passenger cars – USD 27.01 million; wheat - USD 22.6 million; cigarettes – USD 19.3 million; meat products – USD 16.69 million; truck – USD 16.62 million.
