
| Georgia's Foreign Trade in Jan.-Sept.2013 |
| Civil Georgia, Tbilisi / 24 Oct.'13 / 22:11 |
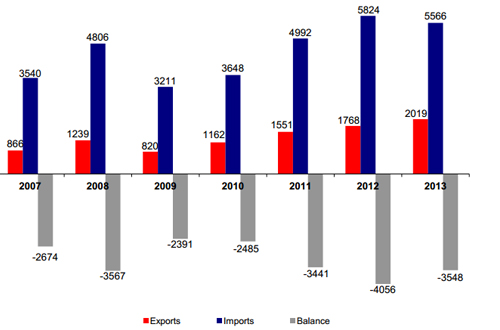
Georgia’s January-September foreign trade figures between 2007 and 2013 in million U.S. dollars. Source: Geostat
Georgia’s foreign trade declined 0.1% year-to-year in the first nine months of 2013 to USD 7.58 billion with the trade gap decreasing by 12.5% y/y to USD 3.54billion, according to figures released by the state statistics office, Geostat, on October 24.
Imports were down by 4% y/y in January-September 2013 to USD 5.56 billion and exports rose 14% y/y in the first three quarters of this year to slightly over USD 2 billion
Re-export of cars lead the pack with USD 511.7 million, increasing 18.4% y/y and accounting 25.3% of Georgia’s total exports in January-September 2013, followed by ferroalloys – USD 183.2 million (9.6% y/y decline); nitrogen fertilizers – USD 98.9 million (5.5% y/y decline); copper ores and concentrates – USD 96.3 million (more than twofold increase); nuts – USD 82.4 million (25.1% y/y increase).
Export of wines and mineral waters saw a significant increase, apparently driven mainly by reopening of the Russian market.
Georgian wine export increased 73.9% y/y in January-September 2013 in value to USD 74.1 million making its share in country’s total export 3.7%.
Export of mineral waters rose 60.1% y/y to USD 72.8 million, accounting 3.6% of Georgia’s total exports.
Reopening of the Russian market also boosted trade turnover between the two countries, mainly due to increased exports making Russia Georgia’s fourth largest trading partner in January-September, 2013 with USD 501.7 million, a 35% y/y increase.
Russia was Georgia’s sixth largest trading partner in 2012 and the fifth largest in the first half of 2013.
In January-September, 2013 Georgian exports to Russia increased more than threefold over the same period of last year to USD 103.6 million and imports increased 17.4% y/y to USD 398 million.
Turkey remains Georgia’s largest trading partner with slightly over USD 1 billion in the first nine months of this year, followed by Azerbaijan with USD 958 million; Ukraine - USD 555.7 million; Russia – USD 501.7 million; China – USD 451.2 million; Germany – USD 368.8 million; Armenia – USD 343.7 million; the U.S. – USD 306.1 million; Bulgaria – USD 246.1 million and Romania – USD 228.1 million.
Oil products top the list of imports totaling USD 667.6 million in January-June 2013, followed by cars – USD 516.4 million; medicines – USD 198.7 million; hydrocarbons – USD 192.7 million; wheat – USD 114 million; mobile and other wireless phones – USD 99.8 million; cigarettes – USD 74.5 million; copper ores and concentrates USD 70.8 million; computers – USD 60.1 million; trucks – USD 57 million.