
| Georgia's Foreign Trade in H1'14 |
| Civil Georgia, Tbilisi / 24 Jul.'14 / 19:08 |
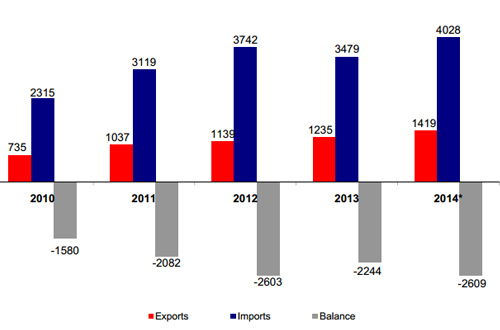
Georgia’s foreign trade figures in January-June of 2010-2014 in million U.S. dollars. Source: Geostat
Georgia’s foreign trade increased 16% year-on-year in the first half of 2014 to USD 5.44 billion with the trade gap increasing by 16.2% y/y to USD 2.6 billion, according to figures released by the state statistics office, Geostat, on July 24.
Exports increased 15% y/y to USD 1.41 billion in January-June 2014 and import increased 16% y/y to USD 4 billion.
Turkey remains Georgia’s largest trade partner with total turnover of USD 939.5 million in the first six months of this year, followed by Azerbaijan – USD 584.2 million; China – USD 380.2 million; Russia – USD 363.8 million; Ukraine – USD 326.9 million; Armenia – USD 270.4 million; the U.S. – USD 259.7 million; Germany – USD 251.4 million; Bulgaria – USD 195.2 million; Japan – USD 159.4 million.
Georgia’s trade turnover with the EU-member states amounted to USD 1.4 billion in January-June 2014, a 15% y/y increase.
Georgian exports to EU-member states reached USD 296 million, a 41% y/y increase and import from the EU increased by 9% y/y to USD 1.1 billion, according to Geostat.
Georgia’s trade with CIS-member countries stood at USD 1.7 billion in the first half of 2014, a 10% y/y increase. Georgian exports grew 11% to USD 758 million and imports from CIS-member states increased 9% to USD 957 million.
Re-export of cars still leads the pack in Georgia’s total exports with USD 289.2 million in the first half of 2014, which is down by 9% compared to the same period of 2013. Decline is mainly attributed to the decrease of re-export of vehicles to Azerbaijan, which was apparently caused by new regulations imposed by Azerbaijan starting from April, banning import of vehicles manufactured in EU before 2005, in the U.S. before 2004 and in Japan before 2011.
Export of ferroalloys follows re-export of cars with USD 160.7 million; copper ores and concentrates – USD 137.6 million; wines – USD 84.8 million (2.5-fold increase over the first half of 2013); nitrogen fertilizers – USD 73.9 million; mineral waters – USD 72.6 million (1.6-fold increase over the first half of 2013); non-denatured ethyl alcohol and spirits – USD 43.9 million; bars and rods of iron and steel – USD 38.8 million; medicines – USD 38.2 million; semi-finished products of iron – USD 28.8 million.
Oil products remain on top of the list of imports with USD 416.9 million, followed by cars with USD 331.7 million; hydrocarbons - USD 181.2 million; medicines - USD 147.4 million; copper ores and concentrates – USD 93.5 million; mobile and other wireless phones – USD 84.8 million; gas turbines – USD 66.8 million; metal construction materials – USD 47.6 million; wheat – USD 47.1 million; computers – USD 44.9 million.